How to calculate NPS: formula, examples and interpretation
Learn how to calculate NPS, classify promoters, passives and detractors, and turn the score into action.
What the NPS calculation means
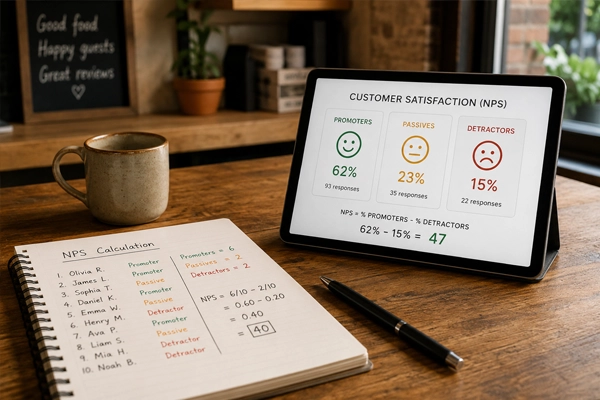
NPS is calculated by subtracting the percentage of detractors from the percentage of promoters. The core question is usually: on a scale from 0 to 10, how likely are you to recommend our company?
Scores 9 and 10 are promoters. Scores 7 and 8 are passives. Scores from 0 to 6 are detractors. The formula is: % promoters - % detractors = NPS.
A simple example
If a company receives 100 responses, with 62 promoters, 24 passives and 14 detractors, the NPS is 62 - 14 = 48. Passives are included in the total response base, but they do not add or subtract directly.
This matters because many passives can hide a lukewarm experience. The score may look acceptable, but the company may not be creating enough enthusiasm to generate referrals or reviews.
How to interpret the score
NPS should not be read in isolation. A score of 45 may be strong in one context and average in another. The most useful comparison is against your own history, by channel, location, team or journey stage.
If NPS rises after a service improvement, that is a positive signal. If it drops in one location, the local operation needs attention.
Where Rankke.me fits in this strategy
The practical value of How to calculate NPS: formula, examples and interpretation is not only measuring the customer experience. The real gain comes when each answer creates the right next step. A promoter should not be treated the same way as a passive customer, and a detractor should not receive a public review request before the company has a chance to understand what went wrong.
Rankke.me was built for this workflow. The platform lets the business collect satisfaction signals first, organize responses by customer profile and create safer paths after the answer. Satisfied customers can be invited to leave a public review on Google or another relevant channel. Customers who show dissatisfaction can be routed to a private recovery flow, where the team can listen, solve and document the case.
This matters because customer satisfaction is not isolated from public reputation. If the company asks everyone for a Google review without reading the experience first, it may amplify frustration instead of trust. When the request is based on NPS or satisfaction data, the brand protects itself and uses positive experiences with more precision.
For teams with multiple locations, this also creates management visibility. Leaders can see which unit generates more promoters, which channel creates more friction and where public reputation is at risk before the problem appears in search results.
How to use the article in a conversion workflow
A useful way to apply this topic is to connect education and action. The customer-facing part should be simple: one clear question, a short explanation and a respectful next step. The internal part needs more structure: score classification, responsible owner, response time and a decision about whether the customer should be invited to review publicly.
For example, a promoter can receive a message that thanks them and explains how their public review helps other customers choose with confidence. A passive customer can receive a follow-up question that uncovers what prevented an excellent experience. A detractor can be routed to a recovery message, a call or a support ticket.
This is where the business starts turning content into revenue. Better feedback reduces churn risk, better recovery protects public reputation and better review routing increases social proof where future customers compare options.
Common calculation mistakes
Do not average the scores. NPS is not an average. Avoid making big decisions from very small samples. Also avoid mixing transactional and relational surveys in the same indicator without context.
Consistency makes the score useful. Define who receives the survey, when it is sent and how results are segmented.
From score to action
After calculating NPS, read the comments. Promoters reveal strengths. Detractors reveal risk. Passives show where the experience is not yet memorable.
Rankke.me helps companies collect responses, monitor NPS and connect promoters to Google review flows, turning the metric into reputation and operational improvement.
How to turn this topic into a routine
To apply How to calculate NPS: formula, examples and interpretation consistently, start by defining which customer journey moment you want to measure. A survey sent after support, purchase, appointment or delivery captures a different signal from a relationship survey sent every quarter. Mixing every moment into the same dashboard often creates a clean number that is hard to act on.
Then standardize three decisions: who receives the survey, when it is sent and what happens after each response. Promoters can move to a review request or referral flow. Passives deserve investigation into small frictions. Detractors need fast follow-up, internal registration and a clear owner for recovery.
Metrics to monitor with NPS
NPS becomes more useful when it is analyzed with response volume, response rate, comment themes and variation by location, channel or team. A high score with few answers may be fragile. A medium score with clear comments may be more useful for improving the operation.
It is also worth tracking the conversion of promoters into public reviews. That metric shows whether internal satisfaction is becoming visible proof for future customers.
A practical 30-day plan
In week one, review the question, audience and sending moment. In week two, connect responses to a classification routine: praise, fixable issue, critical issue or suggestion. In week three, create follow-up messages for each group. In week four, summarize the learnings and choose two operational improvements to execute.
This simple cycle prevents NPS from becoming only a number in a report. The metric starts guiding service quality, reputation and growth.
Mistakes that reduce impact
The most common mistake is asking for feedback and never replying. Another is sending too many surveys without context until customers stop paying attention. It is also risky to look only at the score and ignore comments, because the explanation usually points to the next action.
Rankke.me helps organize this cycle by connecting surveys, segmentation, review requests and follow-up in a continuous routine.
How to deepen the analysis before deciding
The next step is to avoid treating How to calculate NPS: formula, examples and interpretation as an isolated metric. A useful analysis separates responses by journey stage, location, channel, customer profile and time period. This shows whether the score reflects the whole business or only a specific part of the experience.
Comments deserve the same attention as the number. A company can have a reasonable NPS and still lose customers because of a recurring operational detail: delays, unclear communication, poor handoff between teams or inconsistent service after the sale. These patterns rarely appear in the score alone. They appear in the words customers repeat.
It is also important to compare trend, not only the current result. A score that moves from 35 to 48 may indicate meaningful improvement, while a score that stays at 70 but loses response volume may be less reliable than it looks. The business should look at score, volume, response rate and comment quality together.
Rankke.me supports this analysis by turning responses into a workflow. The platform helps the team identify which customers should be recovered, which ones can generate visible trust and which themes need operational action. That is how satisfaction measurement becomes a management system, not just a report.
Frequently asked questions
Is NPS an average?
No. It is the percentage of promoters minus the percentage of detractors.
Do passives count?
They count in the response base, but they do not directly add or subtract.
Can I calculate NPS by location?
Yes. For franchises and multi-location businesses, this is often essential.
What matters more, score or trend?
Trend is usually more useful because it shows whether the customer experience is improving or declining.